In the last quarter of my studies at OHSU, I’ve been taking a data visualization class and the next few posts will cover some of the visualizations I created for the class.
In one of the earlier labs of the course we were introduced to the the MoMA artwork collection dataset. Our first tasks were to recreate some plots in analysis of the data published at 538. Then we were asked to create a new plot from the data.
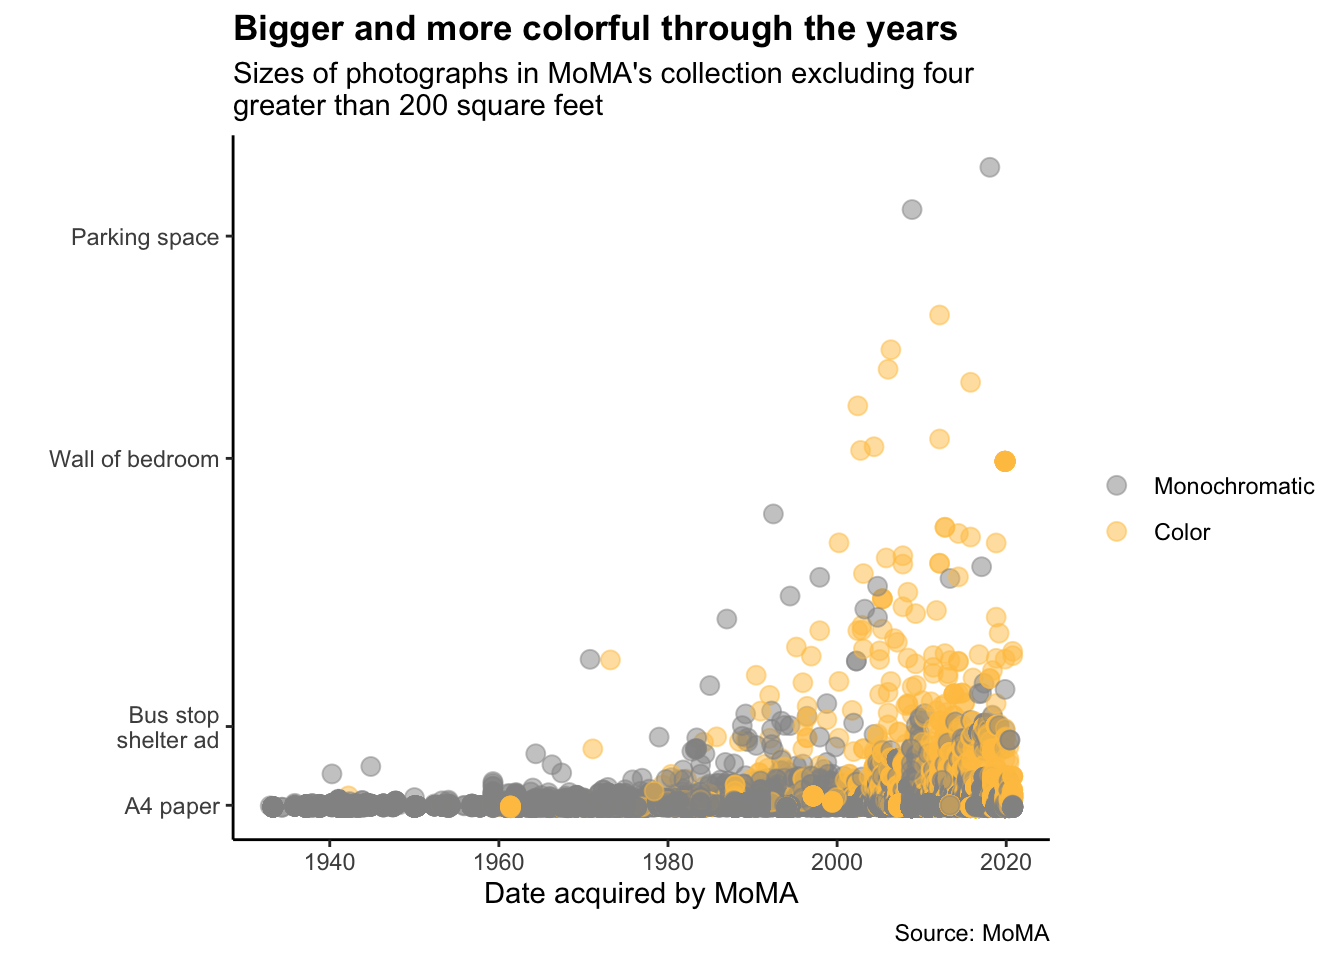
I chose to create a scatter plot tracking the history of additions of works of photography over the years along with the dimensions of the artwork and whether it was a color photograph. The idea is to show the influence of technical factors on an area of art. Color was very limited in the early years of photography and the ability to create large photographic images has increased over time.
The following code creates the plot shown. Whether the photograph is in color or not is determined by if the words ‘color’ or ‘pigment’ are in the Medium field.
# read in full csv from MoMA GitHub
dt <- fread("Artworks.csv")
photos <- dt[Classification == "Photograph"]
setnames(photos, c("Height (cm)", "Width (cm)", "DateAcquired"), c("height_cm", "width_cm", "yearAcquired"))
photos <- na.omit(photos, cols = c("height_cm", "width_cm", "yearAcquired"))
photos[, area := height_cm * width_cm]
photos[, color := grepl("color|pigment", Medium, ignore.case = TRUE)]

ggplot(photos[area < 185806]) +
  geom_point(aes(x = yearAcquired, y = area, color = color),
             alpha = 0.5, size = 3) +
  scale_y_continuous(breaks = c(623.7, 21367.7, 91974, 150503),
                     labels = c("A4 paper", "Bus stop\nshelter ad",
                                "Wall of bedroom", "Parking space")) +
  scale_color_manual(name = "", labels = c("Monochromatic", "Color"),
                       values = c("gray58", "#fec44f")) +
  labs(x = "Date acquired by MoMA", y = "", title = "Bigger and more colorful through the years", subtitle = "Sizes of photographs in MoMA's collection excluding four\ngreater than 200 square feet", caption = "Source: MoMA") +
  theme_classic() +
  theme(plot.title = element_text(face = "bold"))