This summer I worked at the Earle A. Chiles Research Institute doing bioinformatics analyses for a cancer immunology researcher. To allow the researcher to independently perform similar analyses in the future, I created a couple of Shiny apps. These apps are a web interface to interactively explore data. I have demos here and here, and more background information below.
IHC viewer
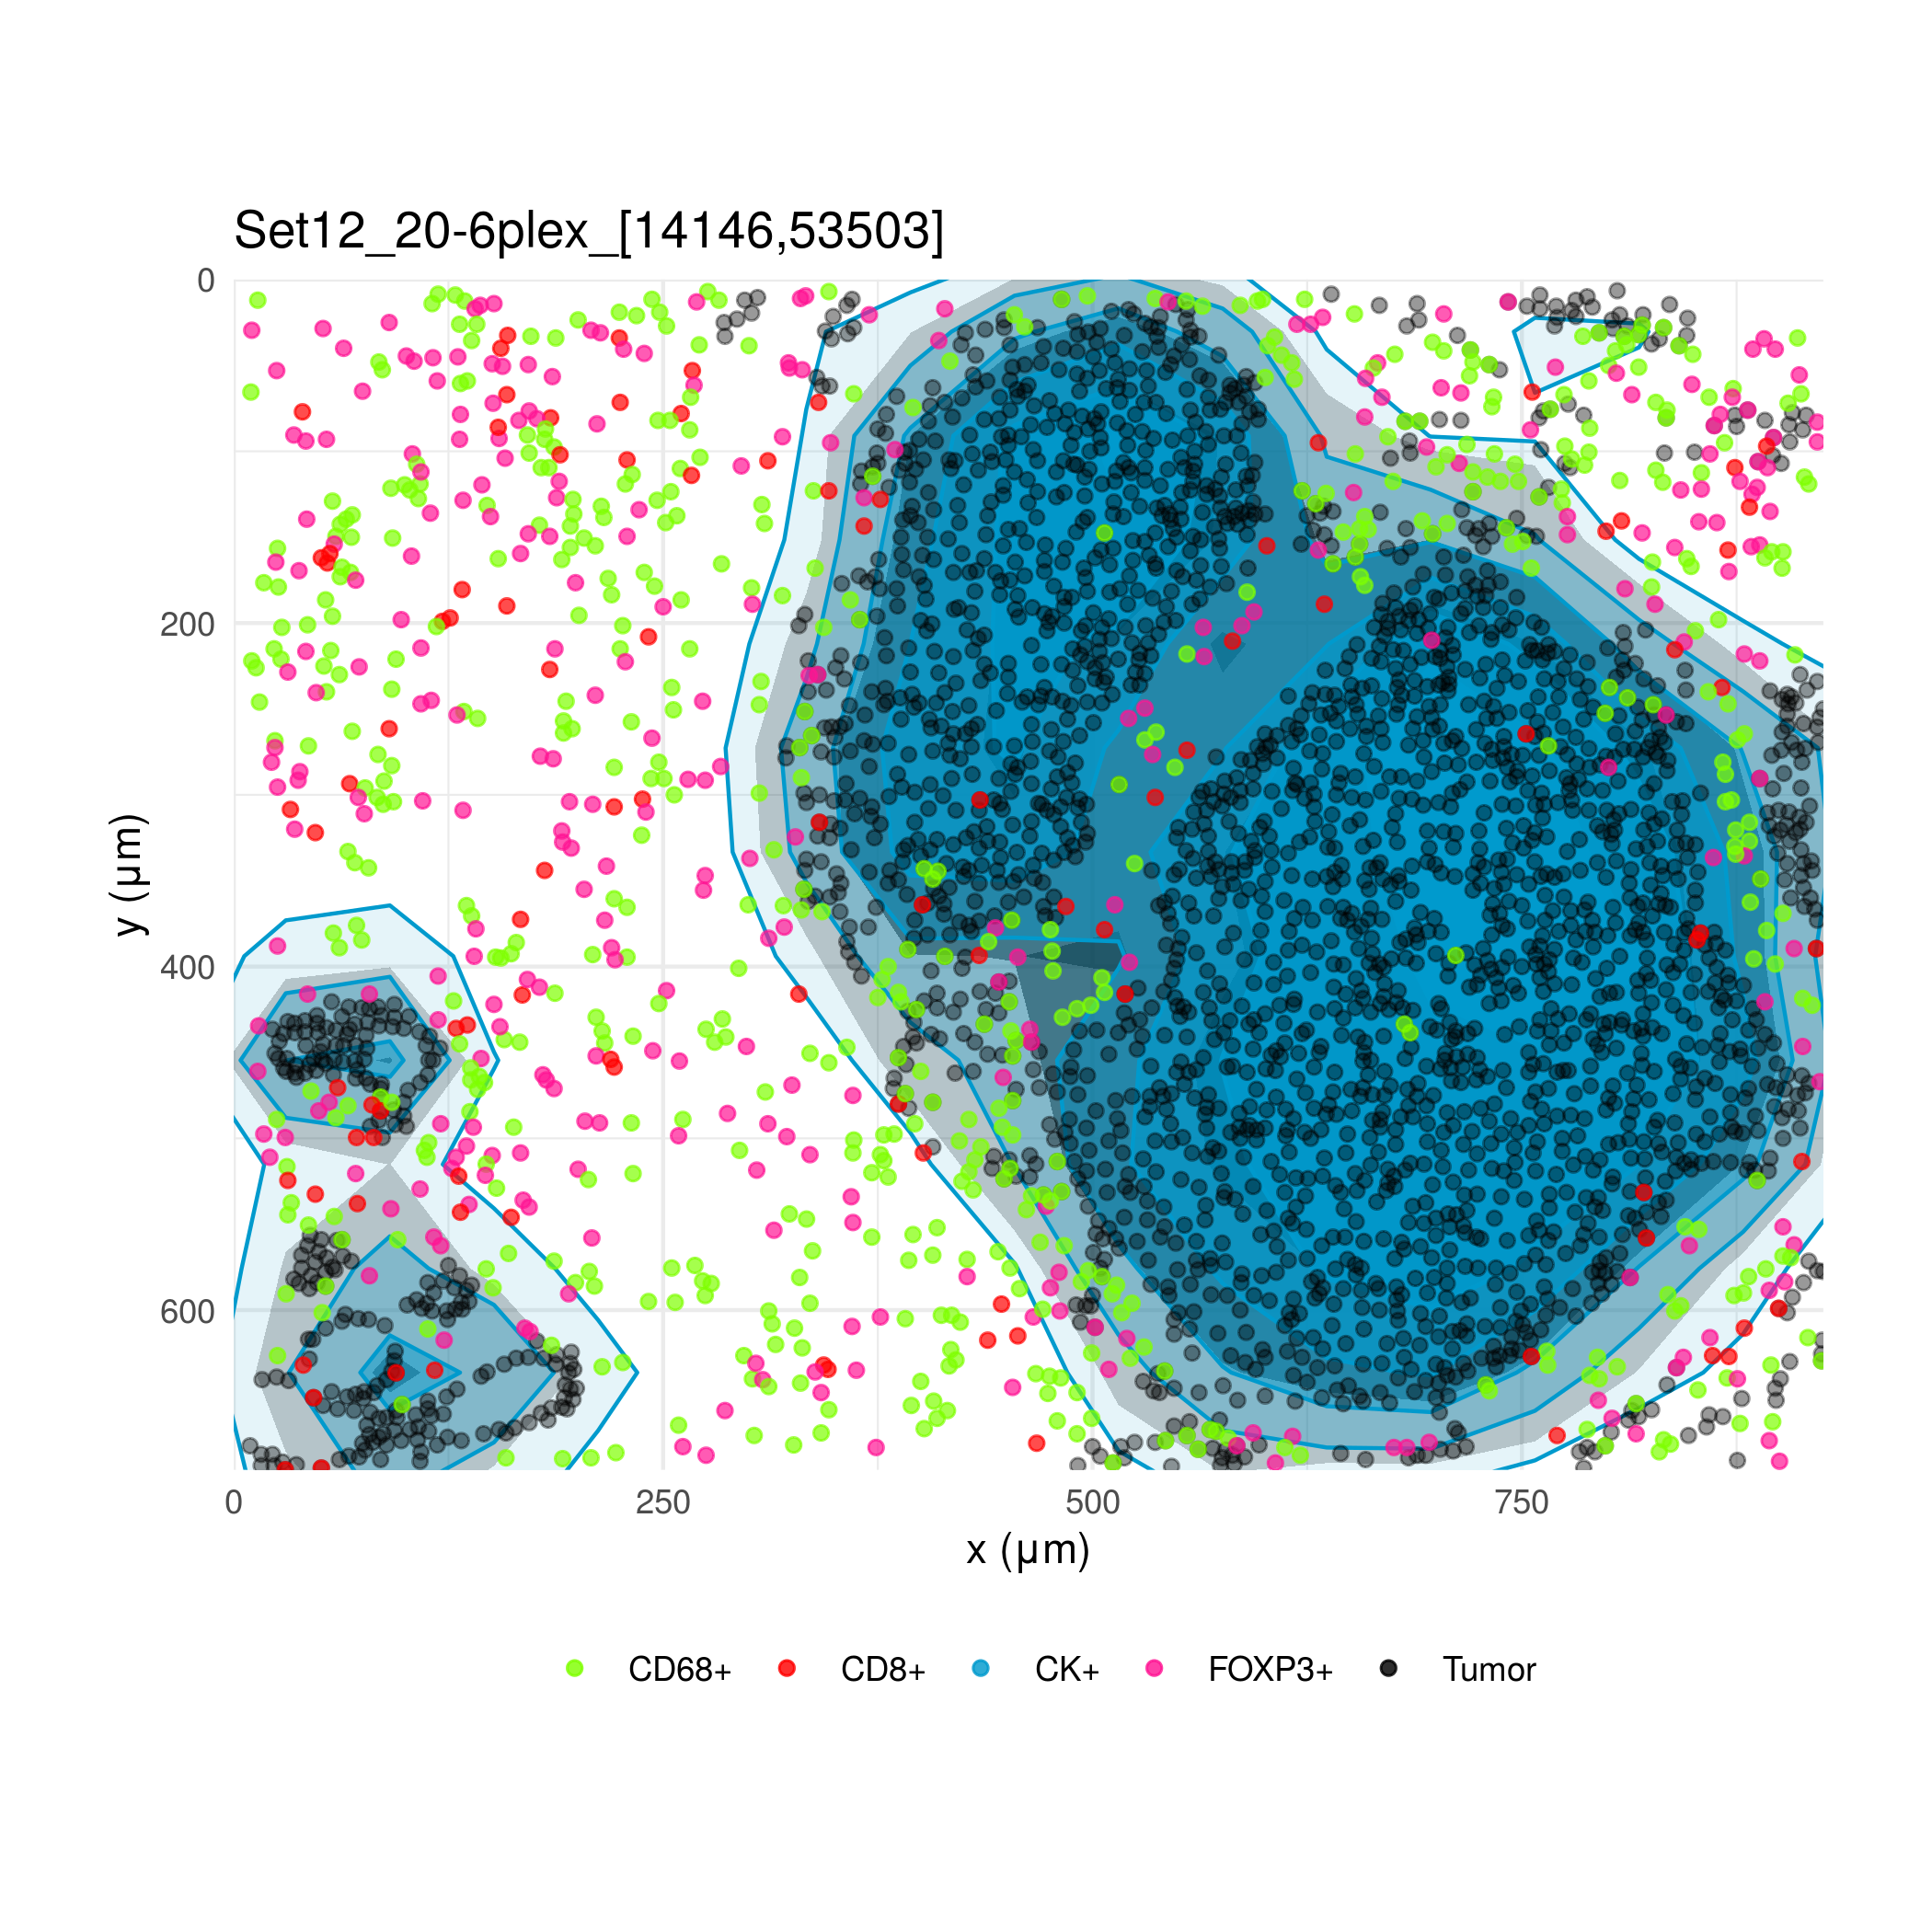
Immunohistochemistry of tumor samples can show the spatial arrangement of different classes of cells in the tumor immune microenvironment. Using software from Akoya Biosciences, a scientist in the lab processed these images and assigned coordinates and phenotypes to several thousand cells in multiple regions of interest. I created an interface to view the arrangement of cells and calculate various statistics, primarily with the R package spatstat.
TCRR
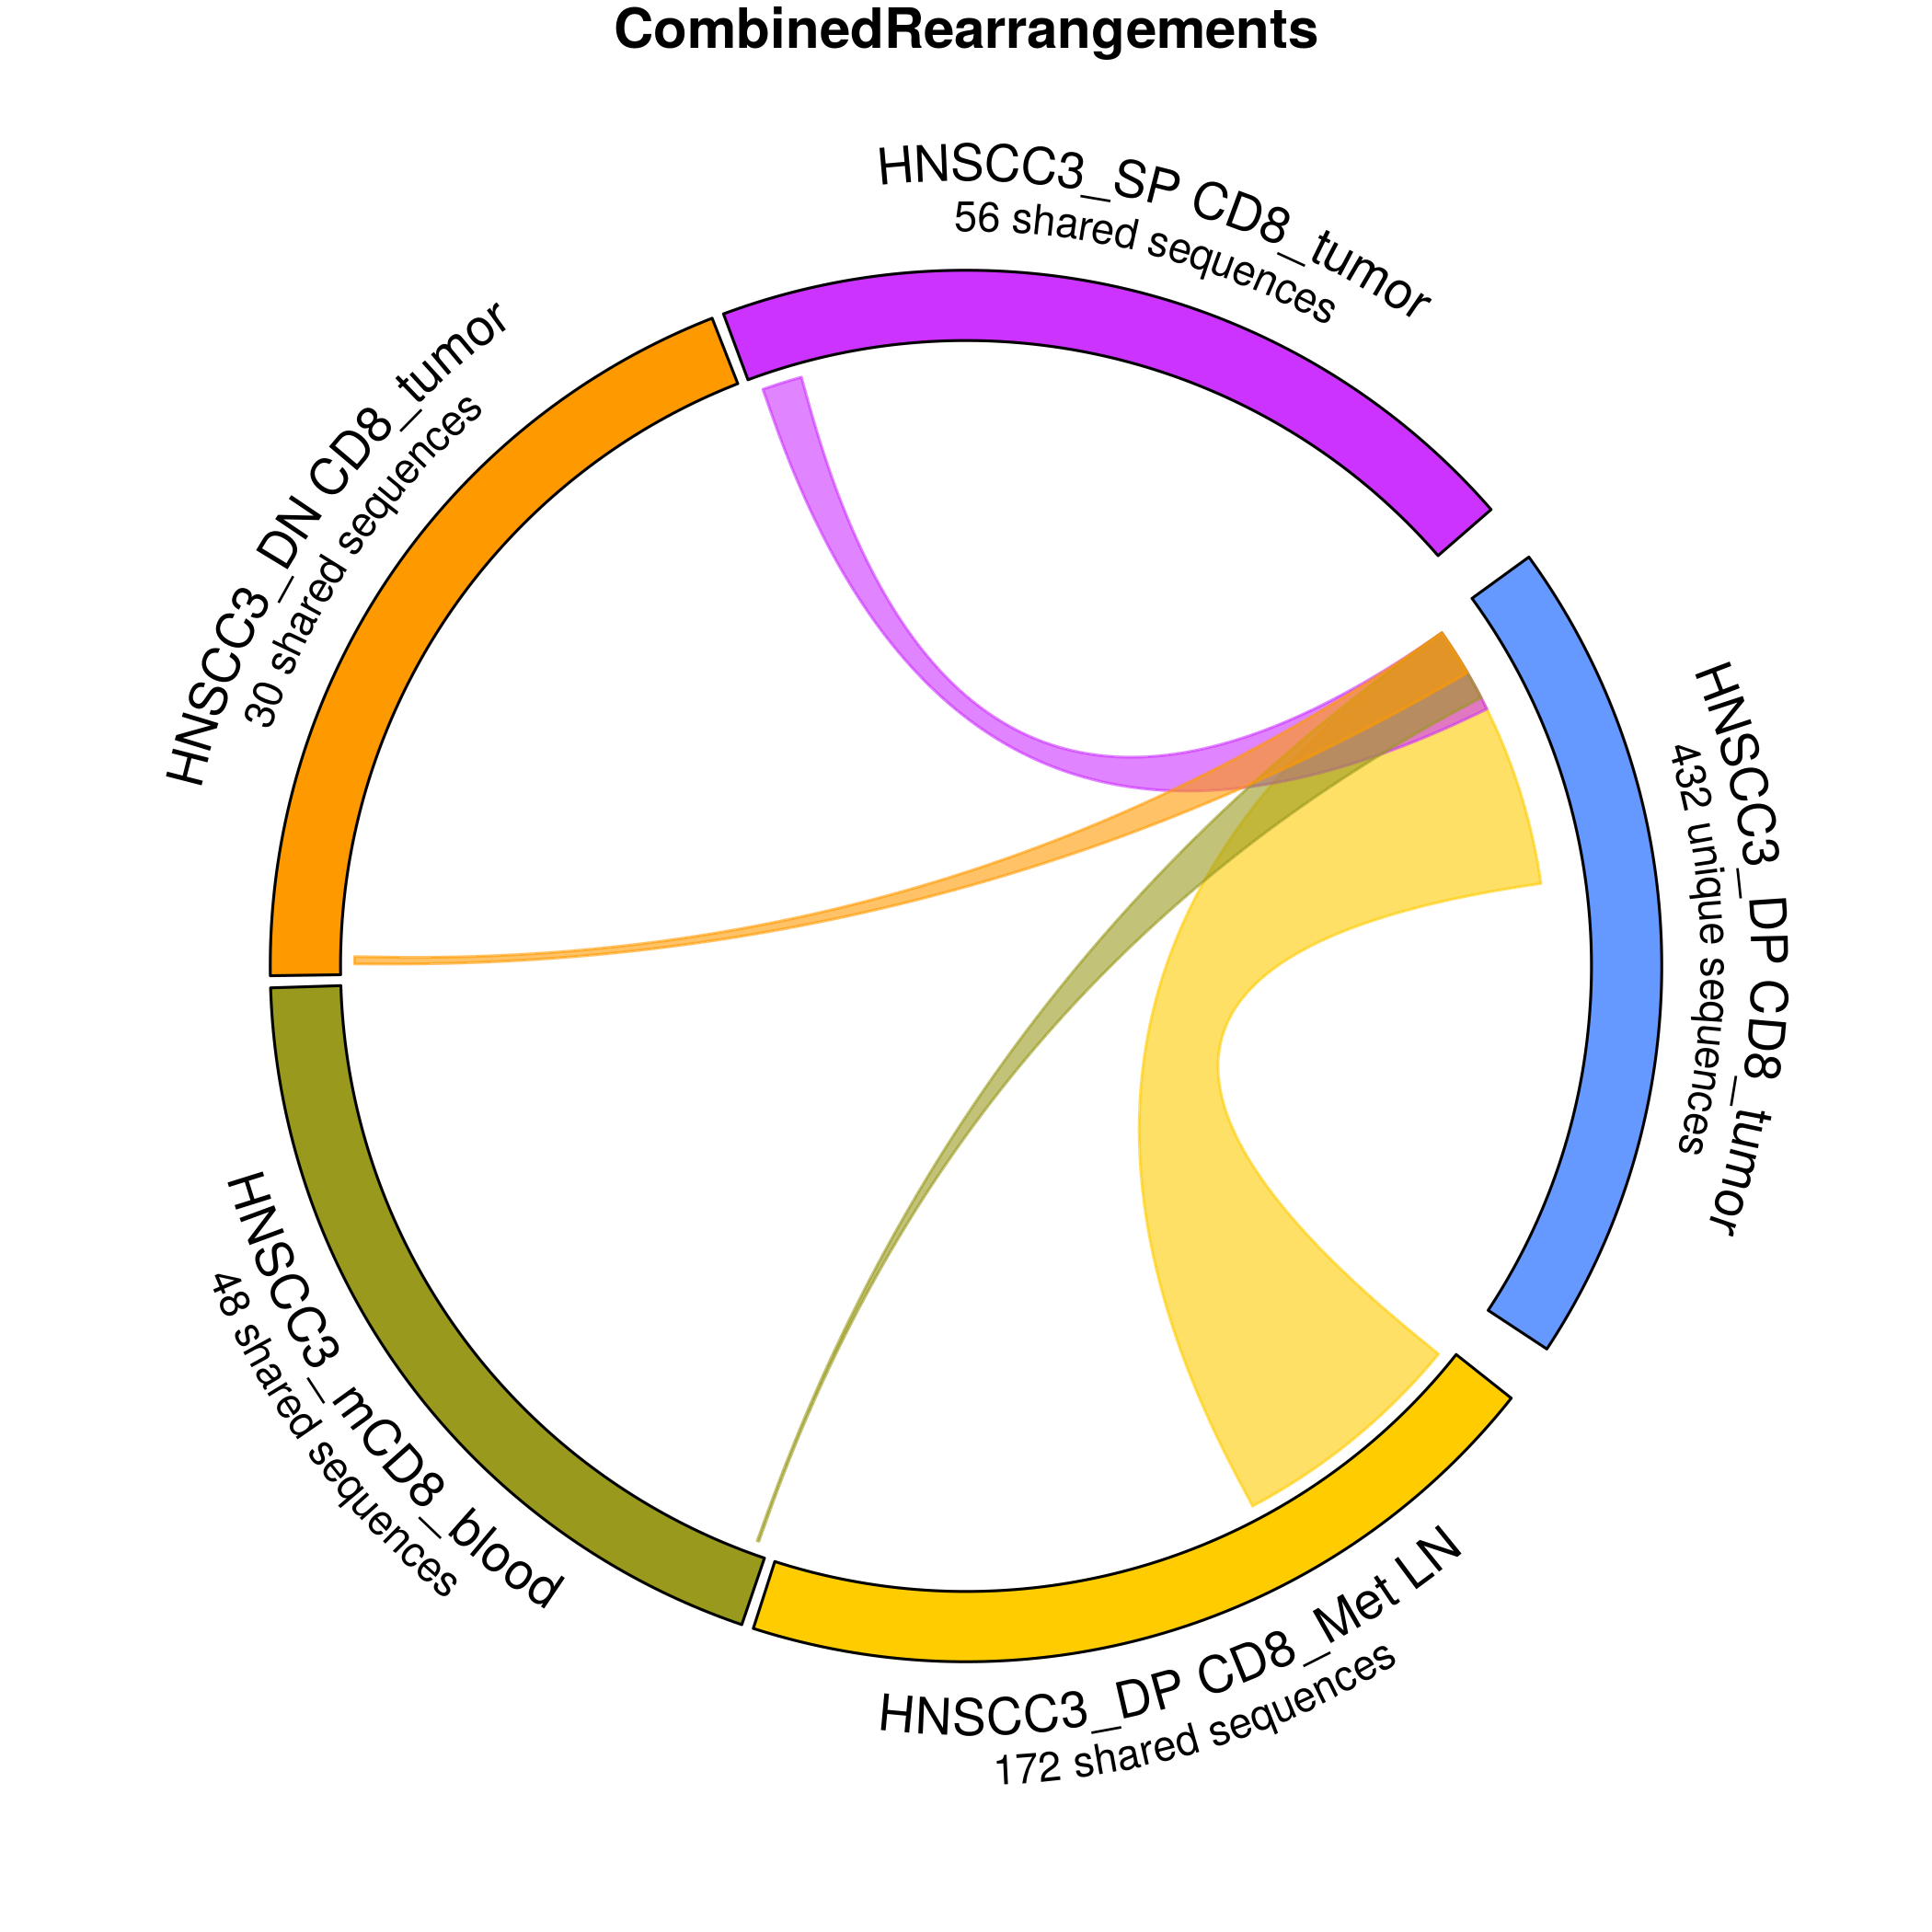
Using data from an assay developed by Adaptive Biotechnologies, this app draws a circos plot showing shared sequences in different cell populations.
Future development
Both of these apps were created specifically for the analyses at hand, for the lab I worked in this summer. I hope to continue development of the apps in the future and share the results with the open source bioinformatics community.