For our final project in data visualization class I explored something I’d thought about when I first came across various papers comparing T-cell receptor repertoire overlap. This challenge comes up in various contexts but for the visualization I create below it is to view the concordance between different methods of sequencing the TCR repertoire. The authors of the methods paper use a series of Venn diagrams with four sets to visualize intersecting sets—where the same clonotypes were detected. For me Venn diagrams break down with greater than three sets.
library(grid)
upset(dt, order.by = "freq", set_size.show = FALSE)
grid.text("Overlap between the most abundant TCR sequences\ndetected by each method",
          x = 0.65, y=0.95, gp=gpar(fontsize=10))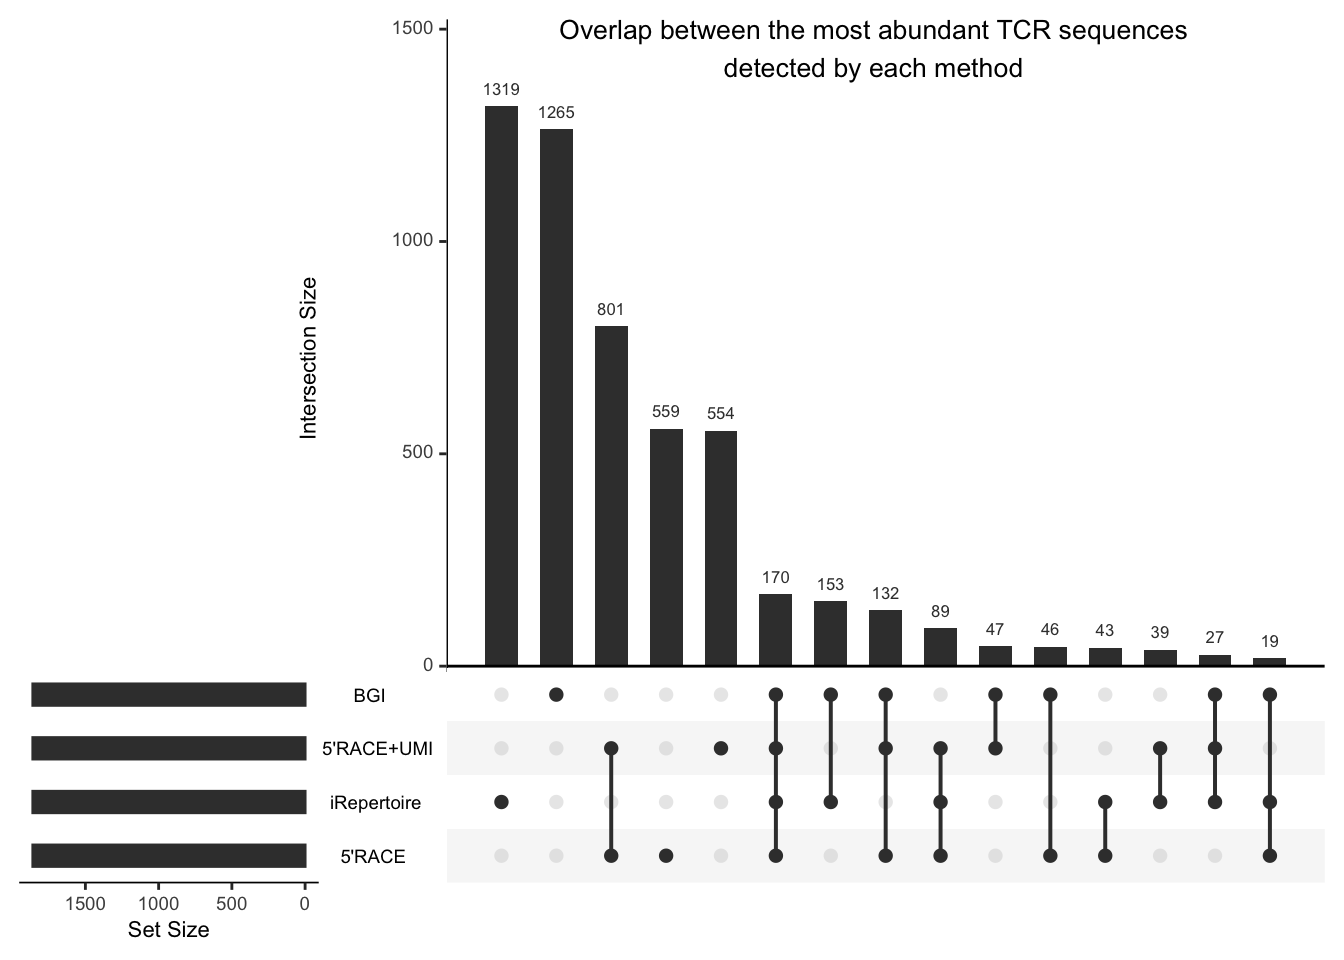
The UpSet plot above is based on the data presented in Figure 3a of Rosati et al as a Venn diagram. A slide deck for an in-class presentation on this visualization is available here.